What is a PivotTable?
In this module, we'll define 'PivotTable' and look at a sample PivotTable while exploring some of its high-level capabilities.
What is a PivotTable?
Download the .XSLX file used in this video to follow along live.
If you’ve been using Excel for a while, you’ve almost certainly heard mention of Pivot Tables. But what is a Pivot Table, and how can it help you analyze data more effectively? In this lesson, we'll go over all the basics you need to know.
Simply defined, a Pivot Table is a tool built into Excel that allows you to summarize large quantities of data quickly and easily. Given an input table with tens, hundreds, or even thousands of rows, Pivot Tables allow you to extract answers to a series of basic questions about your data with minimal effort.
Let’s take a look at a live example to get a better sense for what we mean. This sheet contains a long list of 2014-2016 SnackWorld orders, including data on customers, items ordered, and total sale price.
Let's say that a SnackWorld analyst is tasked with summing up the total dollar sales to each individual customer. The task is urgent, as the SnackWorld CEO wants to see the data for an upcoming presentation that starts in five minutes. How can the analyst complete the task quickly and easily?
The answer is PivotTables. Check out this sheet, which represents a complete list of sales by customer for the year 2016. This report was prepared in about 30 seconds based on the input data tab. It’s captured the data we wanted (the sum of the Order Total column, segmented by customer); and, it includes a comprehensive list of customers on our input sheet.
At a high level, Pivot Tables are most effectively used to summarize data. They’re infinitely flexible, and applicable to a huge variety of situations. For example, given an input dataset of customer orders by date, they could quickly and easily: Sum total sales dollars by customer; Count the total number of orders by customer; Sum total sales dollars by item type; or, Create a two-dimensional table summary showing the maximum order value by customer and month.
If you're a beginner or intermediate Excel user, you may have heard mention of
Simply defined, a Pivot Table is a tool built into Excel that allows you to summarize large quantities of data quickly and easily. Given an input table with tens, hundreds, or even thousands of rows, Pivot Tables allow you to extract answers to a series of basic questions about your data with minimal effort.
That may all seem a bit abstract, so let's dive into a real-world example to get an idea of what a Pivot Table really is.
Defining the problem
Take a look at the below spreadsheet, which is an individual list of SnackWorld's sales to customers by date and item type. The below example only contains twelve rows, but it's important to note that what we're about to discuss also applies to much bigger spreadsheets — our sheet could just as easily contains hundreds or thousands of rows, making it much more difficult to analyze via conventional means.

Let's say that a SnackWorld analyst is tasked with summing up the total dollar sales to each individual customer. The task is urgent, as the SnackWorld CEO wants to see the data for an upcoming presentation that starts in five minutes. How can the analyst complete the task quickly and easily? Here are some options from techniques and formulas we've already learned:
- She could add each customer's sales up by hand. But we know that this approach is inefficient. It is time-consuming, prone to human error, and infeasible if the sheet in question contains hundreds or thousands of rows.
- She could use a
SUMIF formula. ASUMIF formula would help our analyst sum up sales by customer (for more information, check out ourSUMIF tutorial). But it would take time to write the formula, and our analyst might miss a customer or two if the list is particularly large.
Neither of the above options will work particularly well for our analyst. Enter Pivot Tables. This tool will allow her to quickly sum up sales by customer with minimal effort.
Pivot Table example
So, what does using a pivot table to perform these calculations look like? Check out the below example, in which we've used the tool to complete the task above: summing sales dollars by customer.
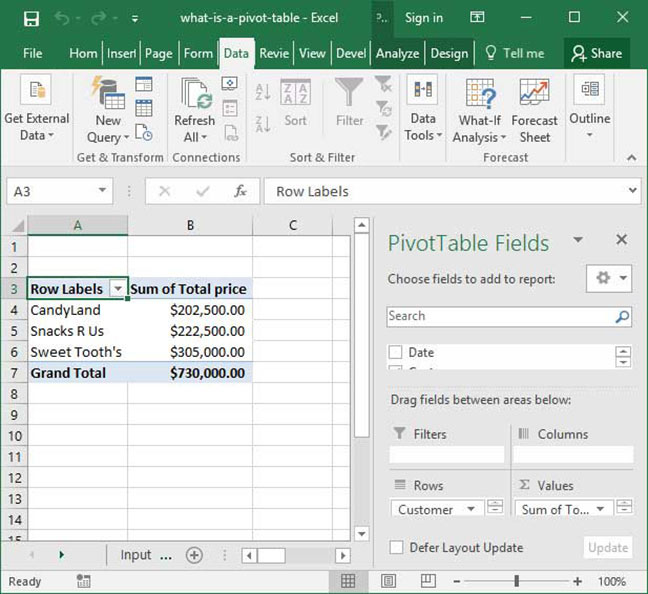
This report was prepared in about 30 seconds based on the input data tab. Notice a couple of things: it's captured the data we wanted (the sum of the
Potential uses of Pivot Tables
At a high level, Pivot Tables are most effectively used to summarize data. Beyond that, they are infinitely flexible, and applicable to a huge variety of situations. Here are some more examples of scenarios in which Pivot Tables could expedite our work. Given an input dataset of customer orders by date, they could:
- Sum total sales dollars by customer;
- Count the total number of orders by customer;
- Sum total sales dollars by item type;
- Create a 2x2 table summary of sales dollars by customer and item type;
- Find the average sale amount to a particular customer in the months of January, February, and March;
- Create a 2x2 table summary showing the maximum order value by customer and month; and
- Create a breakout summary of orders by customer, month, and item type.
The above is just a small subset of ways we could leverage Pivot Tables to analyze our sheet. Once you're familiar with their basic functionality, you'll find that this incredible tool can be applied to numerous analytical scenarios, greatly speeding up your Excel work in a number of different situations.
So, how are Pivot Tables used, and how can we set one up based on our data? Read about how to make a Pivot Table to find out.
Questions or comments on this explainer? Be sure to let us know in the Comments section below. We love to hear from you.