Become a Certified Microsoft Excel Specialist
Learn to create beautiful, automated spreadsheets that can do your work for you
Learn more Enroll todayWhen you finish this training, you'll have a proven plan for
Truly effortless
Excel spreadsheets that do your work for you
Excel is a notoriously difficult program to learn.
According to Investopedia, Excel has "become arguably the most important computer program in workplaces around the world." It's used in virtually every industry — from finance, to consulting, to retail, to manufacturing — and finds its home on the computers of top-tier investment bankers and small business owners alike.
But if you ask most people about their thoughts on Excel, you'll typically get less-than-enthusiastic responses:
- "I'm afraid of Excel. It seems like every time I open it I break something."
- "There are so many formulas and functions that I don't know what to do."
- "My documents are so disorganized that if I don't use them for a while, I totally forget how they work."
- "I can't tell what's going on in my files!"
- "Excel is so boring..."
But say what you will about Excel, the fact is:
If used properly, spreadsheets can do your job for you.
Excel experts know that, when set up properly, the right spreadsheets can cut down on hours of work time and automate huge chunks of your job to free up the day for more interesting things — like that big project you've been putting off; impressing the boss by going the extra mile; or maybe even some much-deserved relaxation.
But how do you do it right? Specifically:
- How do you make sure that your spreadsheets are designed properly? Are you missing out on key features that could save you time and cut down on your workload?
- What are the most important formulas and functions to know? With 300+ functions available in Excel, how can you focus on learning things that will actually matter?
- What's the best way to design spreadsheets that will impress your colleagues? Is your boss satisfied with the quality of your work, and how can you make it better?
- What skills will qualify you for a higher-paying job? How can you use the skills you have to prove to employers that you're worth more money?
These are questions that every good Excel expert should be able to answer. And if you can answer them, you're in a good spot — because:
Excel experts make more money.
As one of the most — if not the most — desirable skills in the job market, in-depth Excel knowledge can make a huge impact on your career trajectory.
Companies from Fortune 500s to startups are willing to pay a lot of money to high-performing analysts who can prove that they've mastered the art of Excel. Solid spreadsheet skills can mean a difference of literally tens of thousands of dollars per year in annual salary — just for knowing how to use this one simple program.
Plus, managers and supervisors at these high-performing companies often come from analytical backgrounds — meaning that knowing Excel back-to-front today can mean more opportunities for manager- and executive-level positions down the line.
So — let's get started.
By now, you know how important Excel is as an analytical tool:
- It is one of the most critical pieces of software to master for a successful career in business;
- It is virtually ubiquitous in workplaces across the country;
- It is immensely complex and difficult to learn without proper guidance; and
- Knowing how to use it right can save you literally hours of work every day — and make your job a heck of a lot easier.
And as a Certified Microsoft Excel Specialist, you'll have the skills to squeeze every once of value you possibly can out of this amazing program. Here's what you'll learn:
Excel fundamentals
Even if you've used Excel before, there are almost certainly a few crucial fundamentals that you've missed. Re-discover all of the important basics, from absolute and relative cell references to automatic formatting using Tables to hotkeys that can double your speed. When we're done, you'll have a solid Excel foundation and be comfortable using spreadsheets at lightning speed.
PivotTables and charts
Explore the power of PivotTables to quickly analyze huge quantities of data and perform calculations that would otherwise take days of manual calculations. Then, unlock the capabilities of Excel charts to make your worksheets beautiful and compelling.
Advanced formulas and functions
Use Excel's advanced set of formulas and functions to accomplish more complicated goals, with complex, multi-tiered lookup formulas and conditional functions that make decisions for you. When you're done, you'll be able to pull data from any source and insert it into a spreadsheet for analysis quickly and easily. And, you'll reduce your time spent manually entering data significantly.
Advanced spreadsheet design
Learn why spreadsheet design is even more important than formulas and functions, and explore how a well-designed spreadsheet looks and feels. Try your hand at separating inputs, outputs, and assumptions in your workbooks and create Excel documents that are easy for others to use (and hard for them to break)!
Financial modeling
Discover the financial modeling techniques used in high-caliber investment banks and consultancies around the world. Learn how to predict a business' growth over time based on a number of input assumptions, and think about how you can apply this knowledge to your own everyday work.
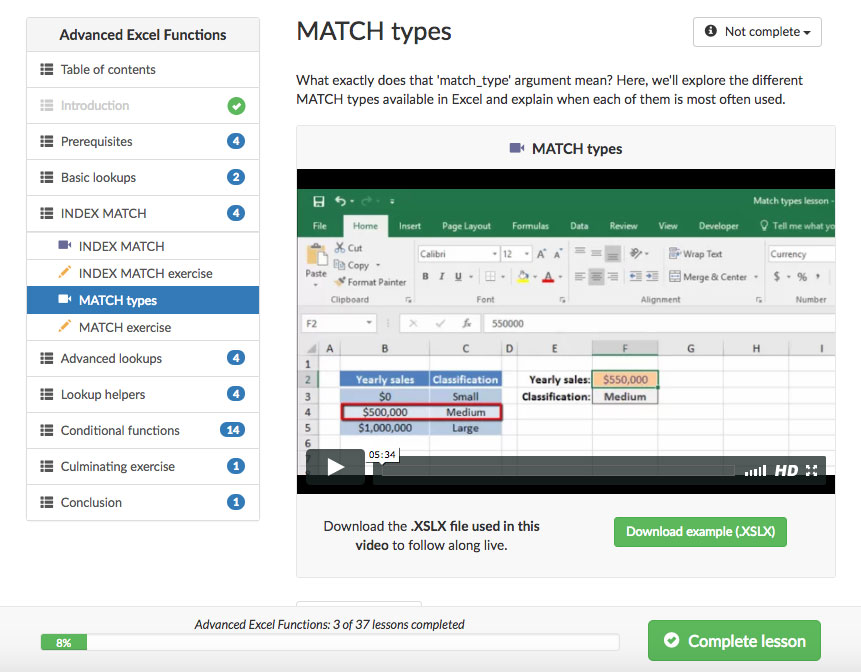
Deskbright's certification interface makes it easy for you to explore video lessons, download exercises, and track your progress
Download over 30 .XSLX exercises along the way to practice what you've learned live
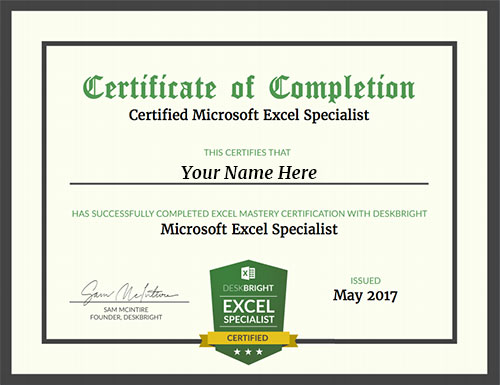
Earn a certificate of completion after passing your final exam
What you'll get
25 video lessons
Access to Deskbright's complete library of video content, with 25 easy-to-follow lessons across 5 core modules. Learn everything you need to know to make Excel do your work for you!
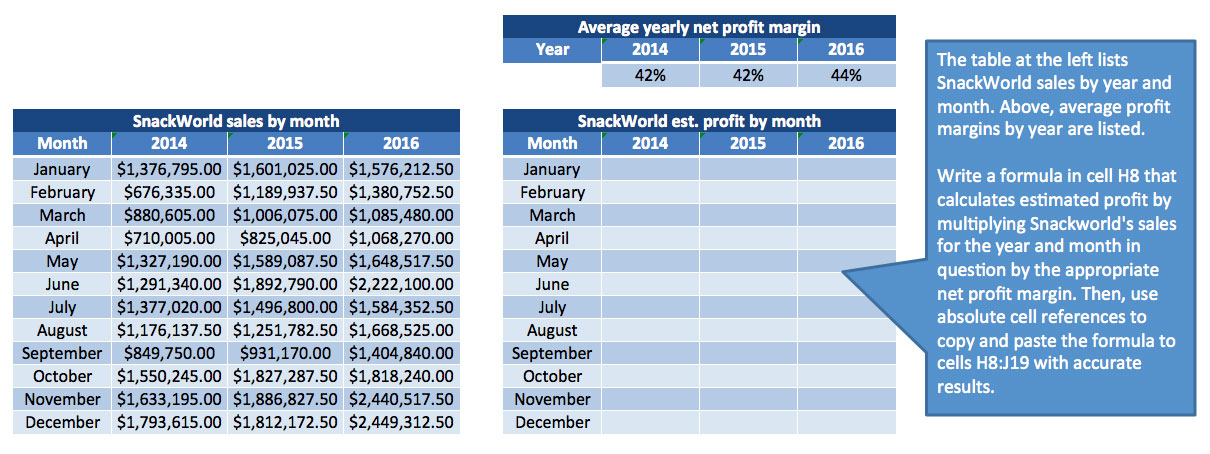
30+ .XSLX exercises
Over 30 downloadable .XSLX files and a culminating project, which contain exercises to help you practice what you've learned. When it comes to Excel, we believe that doing is better than watching!
Final exam and certification
A 50-question final exam to test your spreadsheet knowledge. Upon successful completion of the course and final exam, you'll be a certified Microsoft Excel Specialist.
The curriculum
Forget boring lectures, hard-to-understand articles, and ambiguous instructions. We've done away with all the unnecessary fluff and distilled the core of what you need to know into engaging video courses. Deskbright's extensive curriculum is tailored by master Excel instructors, and is custom-designed to give you the highest possible value per minute of learning.
Click on the name of a module below to see full curriculum details.
Introduction
Introduction
Get started here - we'll go over what you'll learn in this course and how to navigate through sections and lessons.
The Excel interface
What is Excel?
What is Excel, and what is a spreadsheet? Learn the basics in this simple explainer.
Workbook and worksheets
"Workbook" is just another name for an Excel file. Each workbook contains multiple worksheets full of data. Learn more about workbooks and worksheets here!
Rows, columns, and cells
Excel's worksheets are organized into a grid of rows and columns that contain cells. Learn how to use them here!
Shortcuts
Data in Excel can be manipulated extremely quickly and accurately using shortcuts. In this lesson, we'll explore some of Excel's most important hotkeys and how to use them.
Sorting and filtering
Sorting data
In this tutorial, we highlight the best ways to alphabetize and sort a list in Excel, including ascending and descending sorts.
Filtering data
Excel's autofilters allow you to filter a large set of data to show or hide a select subset of rows. Learn how to use them here!
Functions and references
Basic formulas
Formulas are calculations that Excel can perform automatically. Let's experiment with some formulas to add, subtract, multiply, and divide numbers together. Then, we'll look at some formulas that reference other cells.
Formulas exercise
Let's use what we've learned so far to write some basic formulas that perform simple calculations.
What is a function?
What is a function in Excel? Let's walk through the basics of what a function is and how to use one in your spreadsheet.
Functions exercise
Can you use the SUM function to perform some calculations on a basic spreadsheet?
Nested functions
The beauty of functions is all about the synergies between them. Let's learn how to combine functions together to create more complex, nested formulas.
Advanced references
Basic cell references become even more useful when we start tweaking them with absolute and relative modifiers.
References exercise
Try some advanced cell references out for yourself by using the '$' sign to convert pointers from relative to absolute.
Formatting data
Freezing panes
Freezing panes allows us to keep column headers and row labels displayed on our screen as we scroll through an Excel sheet.
Number formats
Use Excel to format your numbers as currency, numerals, and more!
Formatting cells
Excel contains a huge variety of cell formatting options, like colors, borders, and more.
Tables
Tables are a data construct built in to Excel that allow us to manipulate similar ranges of data quickly and easily.
Tables exercise
Try your hand at converting a normal data range into a beautiful Table with easy references.
Conclusion
Conclusion
This marks the conclusion of our course! Check in here to review what we've learned.
Introduction
Course introduction
Get started here - we'll go over what you'll learn in this course and how to navigate through sections and lessons.
Prerequisites
Overview of prerequisites
In this lesson, we'll briefly review the prerequisites for completing this course. Don't worry - they're minimal!
Rows, columns, and cells
Learning to manipulate rows, columns, and cells will set a solid foundation for the rest of our work in Excel.
Number formats
In Excel, numerical values can be formatted one of many ways - with or without decimals; with preceding currency symbols; as dates, and more. Learning to properly format numbers is a critical step before we dive into PivotTables.
What is a PivotTable?
What is a PivotTable?
In this module, we'll define 'PivotTable' and look at a sample PivotTable while exploring some of its high-level capabilities.
Prepping the data
Preparing the data
Before creating a PivotTable, we'll need to carefully prepare a set of source data to ensure that it's clean and properly formatted. Without clean source data, it's likely that our PivotTable will contain errors!
Data prep exercise
Now that you've learned how to prepare PivotTable data, it's time to try things out for yourself. Can you convert a large spreadsheet of raw data into properly-formatted PivotTable input?
Creating a simple PivotTable
Simple PivotTables
Now that our data is properly formatted, we can move on to the good stuff: creating a simple PivotTable. In this lesson, we'll explore PivotTable basics and show a simple example of a Pivot in action.
Basic PivotTable exercise
Now that you've learned how to prepare PivotTable data, it's time to try things out for yourself. Can you convert a large spreadsheet of raw data into properly-formatted PivotTable input?
Advanced PivotTables
Pivots in two dimensions
One-dimensional PivotTables like the one we built in the last section are just the beginning! In this module, we'll build an even more advanced PivotTable by displaying data across two dimensions.
2D PivotTables exercise
Now that you've learned about two dimensional PivotTables, it's time to prepare one of your own.
Filtering PivotTables
One of PivotTables' most powerful features is the ability to filter by any row or column on-demand. In this lesson, we'll learn how to apply filters to our PivotTables to refine our data.
Different summaries
Until now, we've been using the SUM function to aggregate data without our PivotTables and cut it across multiple dimensions. But Pivots can also aggregate data using other functions - like AVERAGE and COUNT - for even more complex summaries.
Grouping headings
Sometimes, showing a PivotTable row or column for every data point in our set doesn't make sense. For example, when we're working with dates, it makes sense to show data grouped by year or month rather than individual day. Pivots allow us to do just this!
Conclusion
Conclusion
Over the course of the past few hours, we've learned how to prepare data, create a PivotTable, and format with multiple different styles. Let's review!
Introduction
Introduction
Welcome to the class! Let's get started with a brief overview of what we'll learn and how to navigate your new course.
Prerequisites
Prerequisites
Before diving into our course, there are a couple of important prerequisite lessons we'll need to learn. Don't worry - they're minimal!
Function basics
Let's review the basics of Excel formulas and functions to build a foundation for some of the capabilities we'll use when creating our charts.
Paste special
The Paste Special command has many uses, but we'll use it to convert formulas to values before we create our charts.
SUMIF
Excel's SUMIF function allows you to take the sum of a column or row of data conditional upon a particular criteria row.
SUMIFS
SUMIFS is very similar to Excel's SUMIF function, but it allows you to take the sum of a range based on multiple criteria rather than using a single condit
Data formatting
Why format data?
Before we jump into chart creation, we'll need to format our input data. Let's learn why data formatting is important!
Formatting input data
Before creating a chart, we'll need to carefully prepare a set of source data to ensure that it's clean and properly formatted. Without clean source data, it's likely that our chart will contain errors!
Formatting exercise
Now that you've learned how to prepare chart data, it's time to try things out for yourself. Can you convert a large spreadsheet of raw data into properly-formatted chart input?
Creating a chart
Creating a chart
Now that our data is properly formatted, we can move on to the good stuff: creating a simple chart. In this lesson, we'll explore chart basics and show a simple example of a chart in action.
Exercise: Create a chart
Now that you've learned how to create a chart, it's time to try things out for yourself. Can you convert our formatted input data into a beautiful Excel chart?
Formatting a chart
Formatting charts
Creating simple charts is just the beginning. We can also format our charts to make them easier to read - and better to look at!
Chart formatting exercise
Let's start with the chart we created in the last exercise, and add on some formatting options to make it even easier to read.
Data labels
For more data-centric charts, we can use an Excel tool called 'data labels' to ensure that exact values are displayed along with our graph visuals.
Data label exercise
Can you add data labels and data tables to our chart to make the values it displays explicit for viewers?
Linear regressions
Linear regressions
A 'linear regression' is a tool used to help identify a generic trend line within a scattered set of data. Let's learn about them here!
Regressions exercise
Can you create a linear regression line through a scatter plot to identify trends and make predictions about the future?
Conclusion
Conclusion
This marks the conclusion of our charts course! Check in here to review what we've learned.
Introduction
Introduction
Get started here - we'll go over what you'll learn in this course and how to navigate through sections and lessons.
Prerequisites
Prerequisites
Before diving into our course, there are a couple of important prerequisite lessons we'll need to learn. Don't worry - they're minimal!
What is a function?
What is a function in Excel? Our helpful tutorial will walk you through the basics of what a function is and how to use one in your spreadsheet.
Cell references
Excel has two types of cell references: Relative and absolute. Relative references shift as you copy and paste cells. Absolute references do not.
Paste special
The Paste Special command has many uses, but we'll use it to convert formulas to values before we create our charts.
Basic lookups
VLOOKUP
VLOOKUP, one of Excel's most powerful functions, is used to look up data from a foreign table. Learn how to do a VLOOKUP in this handy tutorial!
VLOOKUP exercise
Can you create a basic VLOOKUP function to pull data from an external table?
HLOOKUP
Ever wondered whether it's possible to do a VLOOKUP horizontally rather than vertically? It's easy with the HLOOKUP function!
HLOOKUP exercise
Use your newly-learned HLOOKUP function to pull data from a table that's oriented horizontally rather than vertically.
INDEX MATCH
INDEX MATCH
INDEX MATCH, one of Excel's most useful functions, is an improved alternative to VLOOKUP.
INDEX MATCH exercise
Let's try using INDEX MATCH in a real-world scenario and explore why it's a better alternative to VLOOKUP for many applications.
MATCH types
What exactly does that 'match_type' argument mean? Here, we'll explore the different MATCH types available in Excel and explain when each of them is most often used.
MATCH exercise
Experiment with different MATCH types in an INDEX MATCH formula to solve a distinct set of analytical problems.
Advanced lookups
Two-dimensional lookups
The INDEX function isn't just one-dimensional: it can accept a 'row' as well as a 'column' argument for more complex lookups in two dimensions.
Two-way lookup exercise
Try your hand at using the INDEX MATCH MATCH formulation to dynamically pull values from a two-dimensional data set.
Multi-criteria lookups
INDEX MATCH MATCH works well for data sets that are well laid-out - but what if our data is all in one column? Good news: we can still perform lookups based off of multiple criteria. But things get a bit more difficult!
Expert lookup exercise
Let's bring everything we've learned together by using array formulas to complete an ultra-complex lookup based on multiple criteria.
Lookup helpers
INDIRECT
The INDIRECT function is a helpful add-on to INDEX MATCH and VLOOKUP's functionality. It enables us to choose lookup tabs in real time.
INDIRECT exercise
Use the INDIRECT function to select data from multiple tabs - at the same time.
OFFSET
The OFFSET function moves a selected data range by a specified number of cells vertically or horizontally.
OFFSET exercise
Can you use the OFFSET function to select a lookup table in real-time based on a dynamic criterion?
Conditional functions
The IF function
The IF function serves as the backbone of many of Excel's more advanced conditional formulas. Let's learn how to use it before moving on to our expert-level functions.
IF exercise
Can you use your knowledge of the IF function to construct conditional formulas that evaluate dynamic criteria within a workbook?
SUMIF
Excel's SUMIF function allows you to take the sum of a column or row of data conditional upon a particular criteria row.
SUMIF exercise
Let's take what we've learned about SUMIF and apply it to a real-world data table.
SUMIFS
SUMIFS is very similar to Excel's SUMIF function, but it allows you to take the sum of a range based on multiple criteria rather than using a single condit
SUMIFS exercise
Can you modify our SUMIF formula slightly to accommodate multiple criteria within our data table?
COUNTIF
The COUNTIF function allows you to count the number of occurrences of a specified criteria within a given cell range.
COUNTIF exercise
Let's try using conditional formulas with a COUNT rather than a SUM as the result.
COUNTIFS
COUNTIFS allows you to count the number of rows in a table that satisfy multiple criteria across as many columns as you want.
COUNTIFS exercise
Can you add multiple criteria to our COUNTIFS formula to accommodate multiple columns within our data set?
AVERAGEIF
AVERAGEIF, like its cousins SUMIF and COUNTIF, allows us to take the average of a range based on a specified criteria.
AVERAGEIF exercise
Let's modify our conditional SUM and COUNT formulas to take the AVERAGE of values within our data set, isntead.
AVERAGEIFS
AVERAGEIFS is the multi-criteria version of the AVERAGEIF function, allowing us to AVERAGE a range based on multiple criteria.
AVERAGEIFS exercise
Finally, we'll try our hand at using the AVERAGEIFS formula to take the AVERAGE of rows in a dataset, contingent upon multiple criteria being satisfied.
Culminating exercise
Culminating exercise
In this culminating exercise, we'll bring together everything we've learned in this course to solve a complex data organization and analytical challenge for our manager.
Conclusion
Conclusion
This marks the conclusion of our course! Check in here to review what we've learned.
Introduction
Introduction
Get started here - we'll go over what you'll learn in this course and how to navigate through sections and lessons.
Prerequisites
Overview of prerequisites
Before diving into our course, there are a couple of important prerequisite lessons we'll need to learn. Don't worry - they're minimal!
Using Tables
Tables are a data construct built in to Excel that allow us to manipulate similar ranges of data quickly and easily.
Cell references
Excel has two types of cell references: Relative and absolute. Relative references shift as you copy and paste cells. Absolute references do not.
INDEX MATCH
INDEX MATCH, one of Excel's most useful functions, is an improved alternative to VLOOKUP. Using INDEX MATCH is easy — find out how with our tutorial!
SUMIF
Excel's SUMIF function allows you to take the sum of a column or row of data conditional upon a particular criteria row.
What is a model?
Terminology
Let's familiarize ourselves with a couple of terms that we'll be using throughout this course.
What is a 'model'?
Take a deeper dive into the term 'Excel model' with a real-world example of what a model is and why it's useful.
Why flexibility is important
Why is flexibility in our spreadsheets and models so important? Let's take a look at the advantages of proper spreadsheet design.
Structuring the spreadsheet
Outputs and inputs
Every flexible Excel spreadsheet or model has three primary components: outputs, baselines, and assumptions. Let's examine all three of these pieces and how they work together.
Spreadsheet diagrams
Before diving into Excel, it's useful to create a diagram of your spreadsheet: a basic sketch of how all of its individual pieces will interact together.
Diagramming exercise
Now that you've got a sense for how to diagram a model, let's give it a try! Can you turn these instructions from your manager into a basic model diagram?
Creating the spreadsheet
Wireframing
Once we're in Excel, the first step of creating a flexible spreadsheet is to lay down a 'wireframe': a blank outline of the structure of our data.
Wireframing exercise
Let's try our hand at wireframing our own model based on instructions given to us by our manager. This wireframe will serve as the baseline for the rest of our work!
Data cleaning
Before inserting formulas and values into our wireframe, we'll need to clean whatever source data we've been given to ensure that it's properly formatted for analysis.
Formatting exercise
Now that you've learned how to format data properly, let's try our hand at formatting a sheet of messy source data sent to us by our manager.
Wiring the sheet
Our wireframe is complete, and our source data is clean and properly formatted. Now, it's time for the good part: let's complete our model by 'wiring' up our blank cells!
Wiring exercise
Try your hand at wiring the spreadsheet we've diagrammed and wireframed. Can you choose the proper formulas and functions to fill our blank cells?
Adjustments and analysis
Goal seek
Goal seek allows us to automatically adjust the input or assumption cells of a model to achieve a desired result.
Goalseek exercise
Can you use goal seek to help your manager understand what model inputs are required to achieve a desired output?
Sensitivity analysis
Models aren't just about input and output. Since they often rely upon a set of varied assumptions, it's also helpful to know how changes in those assumptions will affect the final output.
Sensitivity exercise
Can you use sensitivity analysis tables to get a sense for how the output of our model will change when a few key assumptions are modified?
Conclusion
Conclusion
This marks the conclusion of our course! Check in here to review what we've learned.
How it works
Take the course
The course should take 10-15 hours to complete at your own pace — that includes 25 video lessons, 30+ downloadable .XSLX exercises, and a final culminating project.
Pass the exam
You'll have three hours to complete your exam, and a score of 70% or better is required to pass. Don't worry — you'll have three attempts to pass available in case you don't make it the first time!
Display your badge
You'll get a printable Certificate of Completion to frame and display in your home or office, plus a digital badge you can embed in your website or LinkedIn profile
Who should get certified?
Business analysts

Expand your career with skills that can simplify your job, save you time, and make you more money.
Directors and VPs

Understand the capabilities of your employees and challenge them to outperform
Team leads

Train your employees in Excel to improve their efficiency and strengthen your team.
Students

Prepare for a high-powered professional career by arming yourself with in-demand skills.
Admin assistants

Cut down on your busy work by automating the most tedious parts of your job
Founders and CEOs

Run your business more smoothly and let the power of spreadsheets reduce your workload.
Your instructor
This course is taught by master Excel instructor Sam McIntire of Deskbright. Sam taught himself Excel after landing a job at a top management consultancy, and is passionate about sharing his spreadsheet knowledge with others.
With years of experience teaching students around the world advanced Excel skills, his easy-to-follow style is perfect for beginners to advanced learners alike. Sam:
- Has helped thousands of students learn the Excel formulas and functions they need to succeed at work;
- Is an experienced management consultant who learned Excel on-the-job at a top tier firm;
- Has been featured in top business publications like Fast Company, Business.com, and Forbes;
- Has received hundreds of positive reviews and 'thank you' e-mails from students whose work was transformed by his lessons.
In addition to teaching Excel, Sam has founded a number of businesses — most recently, Mosaic, a food company that helps busy professionals eat well.
Quoted in:


Ready to get started?
Pick your program
Mastery Class Only
- 5 core courses
- 25 easy-to-follow video lessons
- 30+ .XSLX exercises to test your skills
- Access to the Ultimate Excel Book
- Practice test
Mastery Class + Certification
- 5 core courses
- 25 easy-to-follow video lessons
- 30+ .XSLX exercises to test your skills
- Access to the Ultimate Excel Book
- Practice test
- Live certification exam
- Displayable mastery badge
- Printable certificate
- Status as a Certified Excel Specialist
Frequently asked questions
How valuable is the certification?
Immensely valuable! Solid Excel skills can set you apart from other candidates when applying for a new job — or, when gunning for a big promotion. And employees who have rock-solid Excel skills are often paid tens of thousands of dollars more than their counterparts. The Deskbright brand is well-respected in the world of Excel (try Googling around for some Excel-related terms and you're bound to see our name) — you're getting trained by the best!
How long will it take to finish the course and receive my certification?
Most students finish the full video course in 10-15 hours. That includes time to review the 25 videos, complete all the text-based tutorials, and complete the 30+ exercises included in this course. That having been said, you'll have unlimited access to the materials in this course to complete at your own pace — so if you take longer, it's not a big deal!
Is the exam hard?
We like to say that it's satisfyingly difficult. By that, we mean that you definitely need to know the materials well to pass — but we're not intentionally trying to be tricky or make you fail. Passing the exam does have to mean something, so we've made it challenging enough that you'll have to have a solid understanding of the course materials to succeed.
Is there a time limit on the exam?
Yes — there's a 3-hour time limit from the time you start the exam to the time you finish it. There are 50 questions on the exam, so that should give you ample time to get through things!
What happens if I fail the exam?
You have up to three attempts to pass the exam (meaning, to achieve a score of 70%) — so if you fail the first time, don't worry! If you fail the exam three times, you'll be required to retake the class. Shoot us an e-mail and we'll reset everything to start you over again.